
T1: Dynamic Charts
上一节
下一节
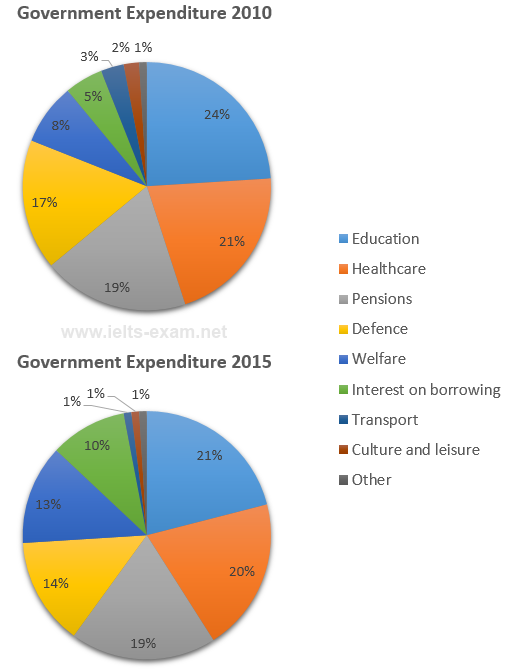
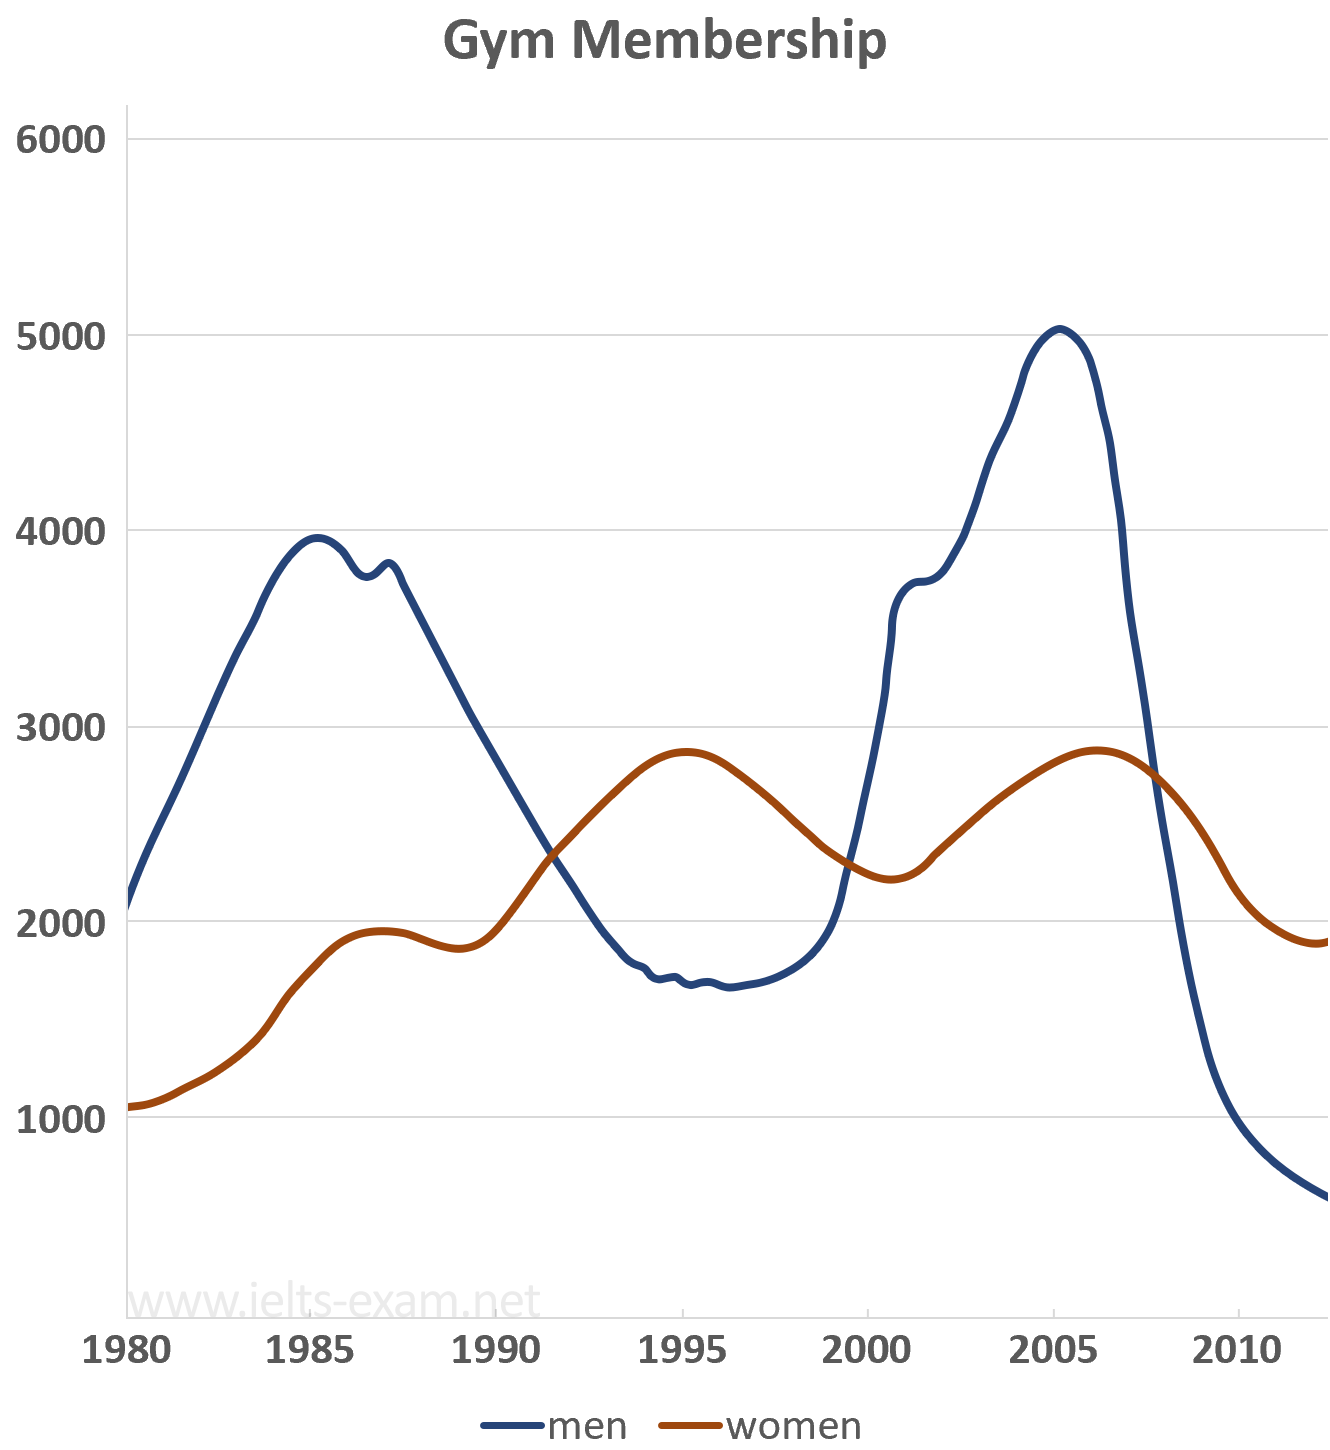
In a DYNAMIC chart, you describe how things go up and down, change or stay the same OVER DIFFERENT TIME PERIODS. In a STATIC chart, you describe how things are similar or different, bigger or smaller INSIDE ONE TIME PERIOD.
Types of dynamic charts:
1) pie chart
2) bar chart

3) line graph
4) table


